Full-featured Alerts System with fully customizable alerts for symbols, portfolios, news, and charts.
“Alerts” program component sits “behind the scenes” monitoring all data that comes in and checks it against the criteria that is entered by the user.
If the criteria are met (for example: “Alert me when {ticker} price hits daily high”, or “Alert me when {ticker} price moves up more than 3 points “), then the alert system will notify the user by using whatever the notification methods were entered for the particular alert.
• Single, multiple symbols and global alerts.
• Charts drown alerts.
• Fibonacci retracements and expansions alerts.
• Price Crossing
• Crossing Daily Range Point
• Moving • Daily High/Low
• 52-week High/Low
• Trailing Stop
• Trade Size • News
• Reminder
• Volume
• Volume % Increase
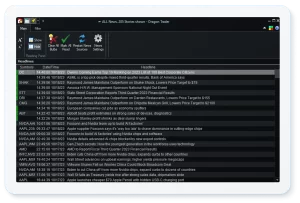
 All News window
The All News window is reached from the Dashboard. It displays all the news that have been collected, in chronological order arranged by source, date, time.
Indications is available for how recently was this item received and whether were already read.
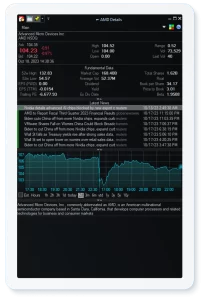
 Detailed Quote window
In the Detailed Quote window shows all the information about a particular stock including all available news for it and a mini chart for real time monitoring.
It can be customized by resizing the panels, changing which panels are visible, or setting the mini-chart’s period.
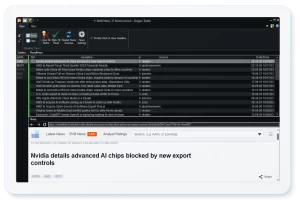
 Symbol News window
The Symbol News window displays all news for a particular symbol with real time notifications for new stories.
 Full-suite technical charts, offering flexibility and full customization. Supporting all chart types, 100+ indicators, alerts and annotations.
Chart Types:
Modifications available for candle or OHLC charts:
Modifications available for historical charts:
Intuitive and convenient control over positions and new and pending orders – all from the chart.
Features when chart trading is enabled:
Possible full customization with a flexible system of trading hotkeys to facilitate fast trading for experienced traders.
System allows hotkeys to be created for almost any buying or selling condition by using friendly Hotkey Editor. The Hotkey Editor also provides the ability to use custom scripts which can be dynamically conditioned on certain parameters.
Available pre-defined shortcuts for platform adjustments:
Streaming real-time market data with highly optimized latency using any one or several of the supported top-of-book, Level I, or depth-of-book, Level II, data feeds.
Main windows:
Depth of Market (DOM) – Allows tracking the real-time market activity and symbol price ladder as well as trading directly on the DOM display.
Time and Sales – displays not only the current information for the trades in real-time, but also the trades from the previous few days.
Level II – shows the current pending bids and asks on various exchanges, in real time.
Depth Charts – displaying the book in cumulative form – that is, the chart’s Y value at any point is the sum of all bids (or asks) from the best bid (ask) to the price value on the X axis.
Customizable real-time scanning using any or all pre-programmed indicators, formula, or a custom logic. Fully programmable with the option to add alerts.
Scanning
Scanning is tied to a Portfolio window. It allows adding a scanning algorithm to a portfolio. The scan would execute, for each row in the portfolio, a mathematical formula involving the symbol’s parameters and technical indicators calculated for that symbol. This would happen continuously, as new data comes in.
Paintbars
Paintbars allows expanding trading strategies and identify trading opportunities. Paintbars are formula-based indicators placed on a chart and are fully integrated with trigger alerts for better control.
Candle pattern detection
Candle Pattern Selection window allows specifying which patterns to detect and how to display them on the chart.
The Risk Terminal gives a great advantage to Managers, Investment Advisors, and Trading groups, allowing a number of Risk and Pre/post Trade operations which facilitate trading and multiple sub-accounts management.
Real-time risk monitoring and trading features
Accounts Window
Positions Window outlines all positions of the client’s sub-accounts:
Orders Window – provides an overview of all orders
If you’re looking for Cost Effective Solution, look no further. We offer a wide range of high quality products at the lowest prices possible…
Best-in-industry, multi-asset class, multi-currency order management solution with sophisticated pre-trade risk capabilities and near real-time margining functionality.
An integrated system that is designed to achieve the best possible outcome when placing orders depending on a complex set of algorithm-specific rules.
Trading API that allows bidirectional interactive communication between the clients and the trading server.
Same format market data regardless of its source. Market data feeds cover all major American and European trading venues and can be delivered according to…